About
This page centralises my R code and tutorials.
(Latest update : 22 April 2017)
Keywords : R, Bioconductor, Genomics, Omics, Cloud, Clinical Trials, Open Data, Big Data, Social Networks.
R Links
My profile of RPubs : https://www.rpubs.com
My profile of Stack Overflow : http://stackoverflow.com
1 Installing R
R (www.r-project.org) is a free statistical and computational environment.
To use R, you first need to install the R environment on your computer. You can also use a virtual machine with R on AWS or on other Clouds. Before you install R on your computer, you will need first to check whether R is already installed on your computer. The R installation and administration procedures are described here.
2 Installing Bioconductor
Bioconductor is an open source project based mainly on R. It provides packages for the analysis, annotation, and visualization of omics and biological data
        source("https://bioconductor.org/biocLite.R")
        biocLite()

        # Install specific packages
        source("https://bioconductor.org/biocLite.R")
        biocLite('AnnotationDbi')
3 R and Bioconductor in the Cloud
A procedure to use R and Bioconductor on Amazon Web Services (AWS) Cloud was described at this URL.
4 Open Data
I developed RBD4Cancer, an R package for Big and Open Data in cancer research. It provides functionalities to access clinical trials, anti-cancer drugs, scientific publications, and many other resources.
Our Open Data on Data.gouv.fr, the French Open Platform for Open Data.
The rOpenGov projects : http://ropengov.github.io.
4-1 Clinical Trials
I provided on my Github examples of R code on how to search, download, and visualize clinical trials data. The R package rclinicaltrials provides an interface to ClinicalTrials.Gov.
            # Install rclinicaltrials package from CRAN
            install.packages("rclinicaltrials")

            # Install the lastest version using devtools::install_github()
            install.packages("devtools")
            library(devtools)
            install_github("sachsmc/rclinicaltrials")

            # Load rclinicaltrials
            library(rclinicaltrials)
            library(ggplot2)
            library(dplyr)

            # Obtaining help
            vignette("basics", "rclinicaltrials")
            clinicaltrials_search()

            # Exploring the data
            MI <- clinicaltrials_search(query = c("cond=Myocardial infarction",
                                       "phase=2",
                                       "type=Intr", "rslt=With"),
                                       count = 10000)
           nrow(MI)
           [1] 40
           table(MI$status.text)

           Active, not recruiting              Completed
                     1                     30
            Terminated
                     9
Other R packages for clinical trials design, analysis, and visualization.
| Package Name | Short Description |
|---|---|
| c212 | Methods for Detecting Safety Signals in Clinical Trials Using Body-Systems (System Organ Classes) |
| dfpk | A Bayesian Dose-Finding Design using Pharmacokinetics(PK) for Phase I Clinical Trials |
| Surrogate | Evaluation of Surrogate Endpoints in Clinical Trials |
| coprimary | Sample Size Calculation for Two Primary Time-to-Event Endpoints in Clinical Trials |
| ADCT | Adaptive Design in Clinical Trials |
| seqmon | Group Sequential Design Class for Clinical Trials |
| BOIN | Bayesian Optimal INterval (BOIN) Design for Single-Agent and Drug- Combination Phase I Clinical Trials |
| BACCT | Bayesian Augmented Control for Clinical Trials |
| randomizeR | Randomization for Clinical Trials |
| pact | Predictive Analysis of Clinical Trials |
| greport | Graphical Reporting for Clinical Trials |
| OptGS | Near-Optimal and Balanced Group-Sequential Designs for Clinical Trials with Continuous Outcomes |
| subgroup | Methods for exploring treatment effect heterogeneity in subgroup analysis of clinical trials |
| sp23design | Design and Simulation of seamless Phase II-III Clinical Trials |
| DSBayes | Bayesian subgroup analysis in clinical trials |
| blockrand | Randomization for block random clinical trials |
| CRM | Continual Reassessment Method (CRM) for Phase I Clinical Trials |
4-2 OpenFDA
Launched in June 2014, OpenFDA aims at facilitating access to publicly available FDA data. OpenFDA allows direct downloads of FDA data
openFDA is a beta research project to provide open APIs. The package openfda is available on Github but has not yet been added to CRAN.
        # Install the lastest version of openFDA using devtools::install_github()
        install.packages("devtools")
        library(devtools)
        devtools::install_github("ropenhealth/openfda")
        # Load openfda
        library("openfda")

        patient_ages = fda_query("/drug/event.json") %>%
        fda_count("patient.patientonsetage") %>%
        fda_exec()
        > Fetching: https://api.fda.gov/drug/event.json?search=&count=patient.patientonsetage
        head(patient_ages)
        term count
        1   60 76181
        2   65 70109
        3   55 68470
        4   62 68195
        5   58 67417
        6 63 66664
A tutorial is available on my github
4-3 Eurostat Open Data
In this R script, I provided some examples on how to use Eurostat Open Data in R. The package Eurostat [1] will be used.
         # Install Eurostat R Package
         install.packages("eurostat")

         # Installing a dvelopment version from github
         library(devtools)
         install_github("ropengov/eurostat")

         # Install required packages
         reqPackages <- c("xml2","rvest","ggplot2","countrycode","tidyr","dplyr","knitr")

         #  Install packages
         inst <- match(reqPackages, .packages(all=TRUE))
         need <- which(is.na(inst))
         if (length(need) > 0) install.packages(reqPackages[need])

         # Load packages
         lapply(reqPackages, require, character.only=T)

         # Load eurostat
         library(eurostat)

         # Searching Eurostat datasets
         results <- search_eurostat("cancer", type = "dataset")
         # Display the first rows
         kable(head(results))
         query$code[[1]]
         ...
A tutorial is available on my github
4-4 The French Open Drug Database
The package RMedicamentsFR will be soon available on Github at this link
The Open Data is accessible on the Website of http://base-donnees-publique.medicaments.gouv.fr.
5 Analysis of Omics Data
This section provides access to R code and Tutorials for quality control, analyis, annotation, and interpretation of Omics Data.
5-1 RNA-Seq
R code and tutorials will be uploaded soon.
5-2 Exome-Sequencing Data
R code and tutorials will be uploaded soon.
5-3 Whole-Genome Sequecing
R code and tutorials will be uploaded soon.
5-4 Mobile Sequecing
This section provides tutorials for the analysis of Oxford Nanopore MinION data. Two R/Bioconductor packages are available to quality assessment (QC) and analysis of data from MinION : IONiseR [2] and poRe [3]. The IONiseR package provides functions for the QC of Oxford Nanopore MinION data. Two datasets example are provided within this package : example.fast5 and example_V2_fast5. IONiseR extracts summary statistics from fast5 files, it can be used either before or after base calling. Functions to visualize metrics about sequencing experiments are also provided in this package.
A dataset example is provided in the Bioconductor data package minionSummaryData. This Salmonella Typhi dataset was published in 2015 by Ashton et al.
Here is the environment required to QC, extract and visualize mobile sequencing data:
        # Install IONiseR Bioconductor package
        # http://bioconductor.org/packages/release/bioc/html/IONiseR.html
        source("https://bioconductor.org/biocLite.R")
        biocLite("IONiseR")

        # Load IONiseR and required packages
        library(tibble)
        library(hwriter)
        library(rhdf5)
        library(ShortRead)
        library(IONiseR)
        library(ggplot2)
        library(gridExtra)

        # Install the minionSummaryData dataset
        biocLite("minionSummaryData")
        library(minionSummaryData)
         ...
An example of code and a tutorial were provided on my github.
6 Mining Social Media Data in R
Since 2012, R provides packages (clients) to access social media data for Twitter, Facebook, Google+ and Intsagram. For Twitter data, eigth packages are available. The package Rfacebook can be used to access Facebook data.
6-1- R Packages to use Twitter API
| Package Name | Short Description | Github | My Tutorials |
|---|---|---|---|
| tweet2r | Twitter Collector for R and Export to 'SQLite', 'postGIS' and 'GIS' Format | --- | Examples |
| R Based Twitter Client | --- | Examples | |
| streamR | Provides functionalities to access to Twitter Streaming API via R | Link | Examples |
| rtweet | Collecting Twitter Data | --- | Examples |
| graphTweets | Visualise Twitter Interactions | --- | Examples |
| shinyBS | Twitter Bootstrap Components for Shiny | --- | Examples |
| smappR | Link | Examples | |
| TwitteR2Mongo | Link | Examples |
6-2- The Rfacebook package
The Rfacebook package provides an interface to the Facebook API. The first version was uploaded to Github on October, 14th 2013.
Reference manual : PDF
6-3- The plusser R packages
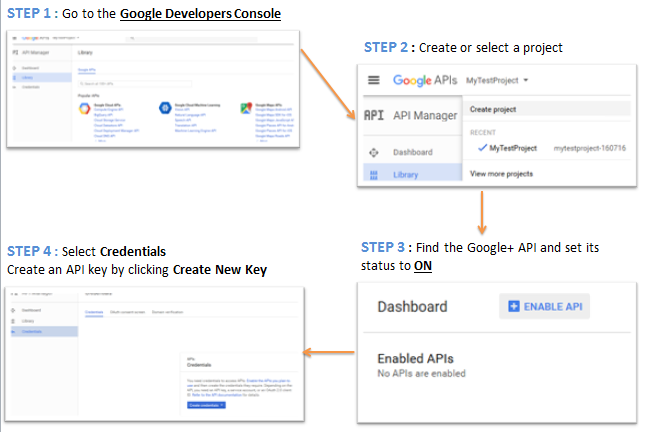
The package plusser[4] provides an API interface to Google+. It provides functions to retrieve posts, profiles and pages. You will need first to create an API Key on Google Developers Console. We provide in the figure below the steps to perform before using Google+ API in R.
More information are available on this page: https://developers.google.com/+/web/api/rest/oauth. Please Refer to the API documentation for details.
The API includes a default per-user limit, but you can modify that value as described here.
I provide on Github an example of R code.
7Google resources in R
This section is being updated.
7-1- Google Trends in R
This section is being updated.
7-2- Using Google Scholar in R
The scholar R package provides functions to retrieve citation data from Google Scholar. The package provides functions for comparing multiple scholars and predicting h-index scores based on past publication records.
        # Installing scholar and depending packages from CRAN
         requiredPackages <- c("scholar","ggplot2","dplyr","stringr",
                       "R.cache","httr","rvest","xml2")
         install.packages(requiredPackages)
         install.packages("scholar")
A tutorial and an exemple of code is provided on my Github.
8 BioNLP and Text Mining
This section is under construction.
References
- [1] Leo Lahti, Przemyslaw Biecek, Markus Kainu and Janne Huovari. Retrieval and analysis of Eurostat open data with the eurostat package. R Journal 2017 (in press; preprint). R package version 3.1.1. URL: http://ropengov.github.io/eurostat
- [2] Smith M (2017). IONiseR: Quality Assessment Tools for Oxford Nanopore MinION data. R package version 1.4.4.
- [3] Watson M et al. (2015). poRe: an R package for the visualization and analysis of nanopore sequencing data. Bioinformatics, 31(1):114-5. PMID: 25173419
- [4] Waldhauser C (2014). plusser: A Google+ Interface for R. KDSS K Data Science Solutions, Vienna, Austria. R package version 0.4-0, http://kdss.at/.
Contacting me
I will be very grateful if you will send me corrections and/or suggestions to my email address seraya.maouche@iscb.org.License
The content of this Website is licensed under a Creative Commons Attribution 3.0 License.